BMI2 Download TestPulse Pro

AIM / FCAPS / Performance

AIM · P · Performance · recorded 2026-10-17

Watch the lab scale itself, and see why some pods don't.

Prometheus, Grafana and KEDA now run on the lab. One dashboard shows every pod's CPU and memory, every autoscaler's replica count against its target, and the exact number KEDA feeds its autoscaler. Two real services autoscale under load; three are deliberately kept at one copy, for reasons written down.

Prometheus + GrafanaKEDA event-driven scaling1 → 3 replicas under loadGrafana not exposed on the network

Lab Autoscaling: Pods, HPA, KEDA

A load test, as Grafana recorded it.

A short load job sent health and readiness requests at two lab services for about seven minutes. Both scaled from 1 to 3 replicas within a minute, then fell back after the two-minute scale-down window. Every number below is from that run.
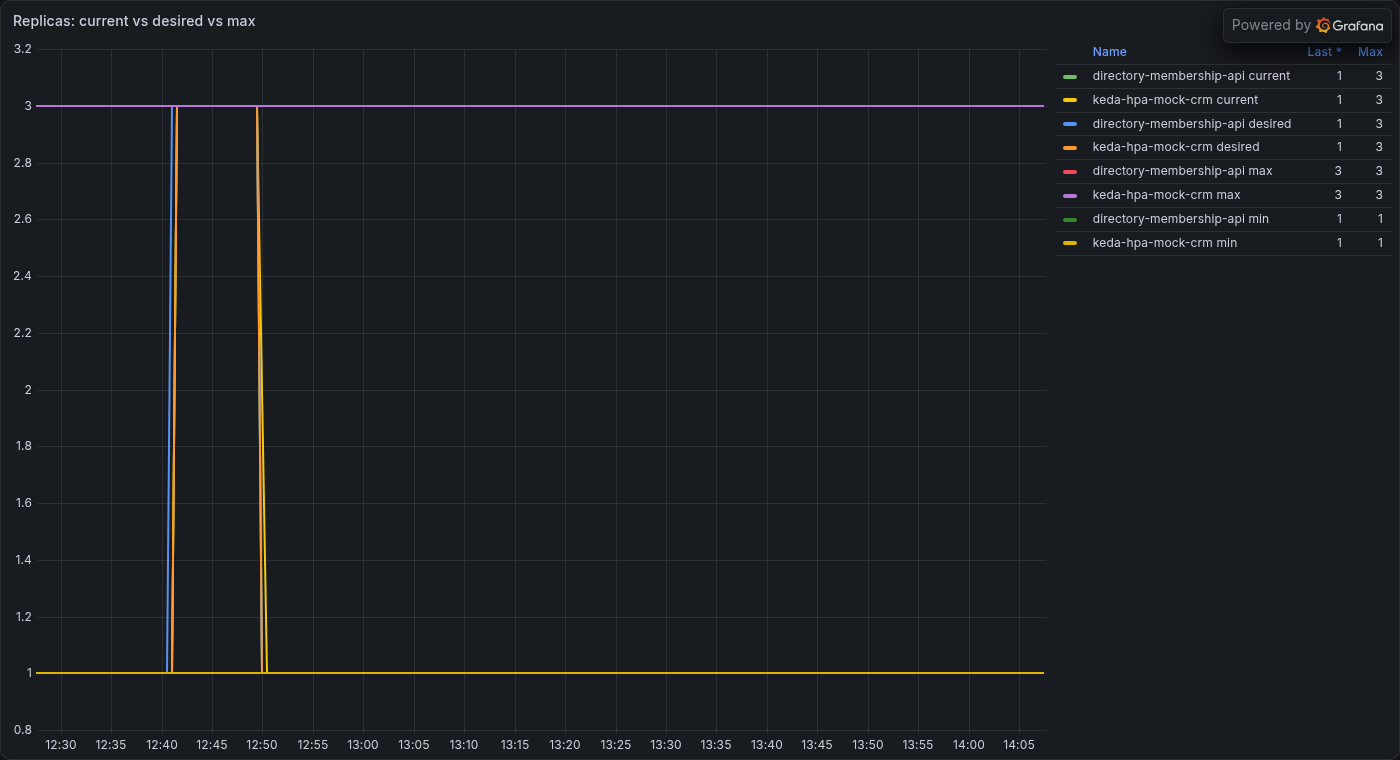
Grafana panel: replicas current versus desired versus max for two autoscalers, both rising from 1 to 3 at about 12:40 and returning to 1 at about 12:50.
Replicas: current, desired, max. Both autoscalers go from 1 to 3 under load and return to 1 after the scale-down window.
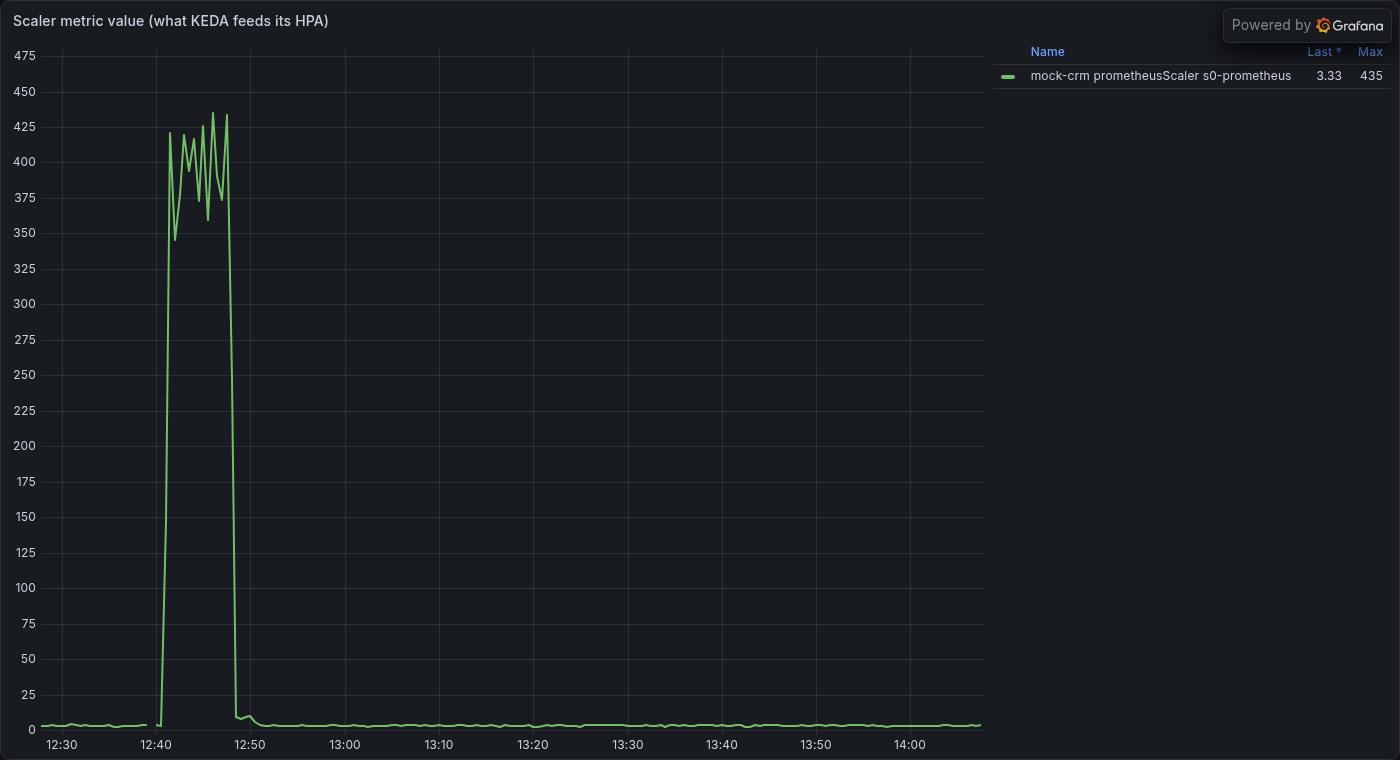
Grafana panel: the KEDA scaler metric for the CRM service rising from about 3 to a peak of 435 during the load, then back to about 3.
What KEDA feeds its autoscaler. The CRM service's CPU in millicores, from a Prometheus query: from about 3 to a peak of 435, against a target of 150 per replica.
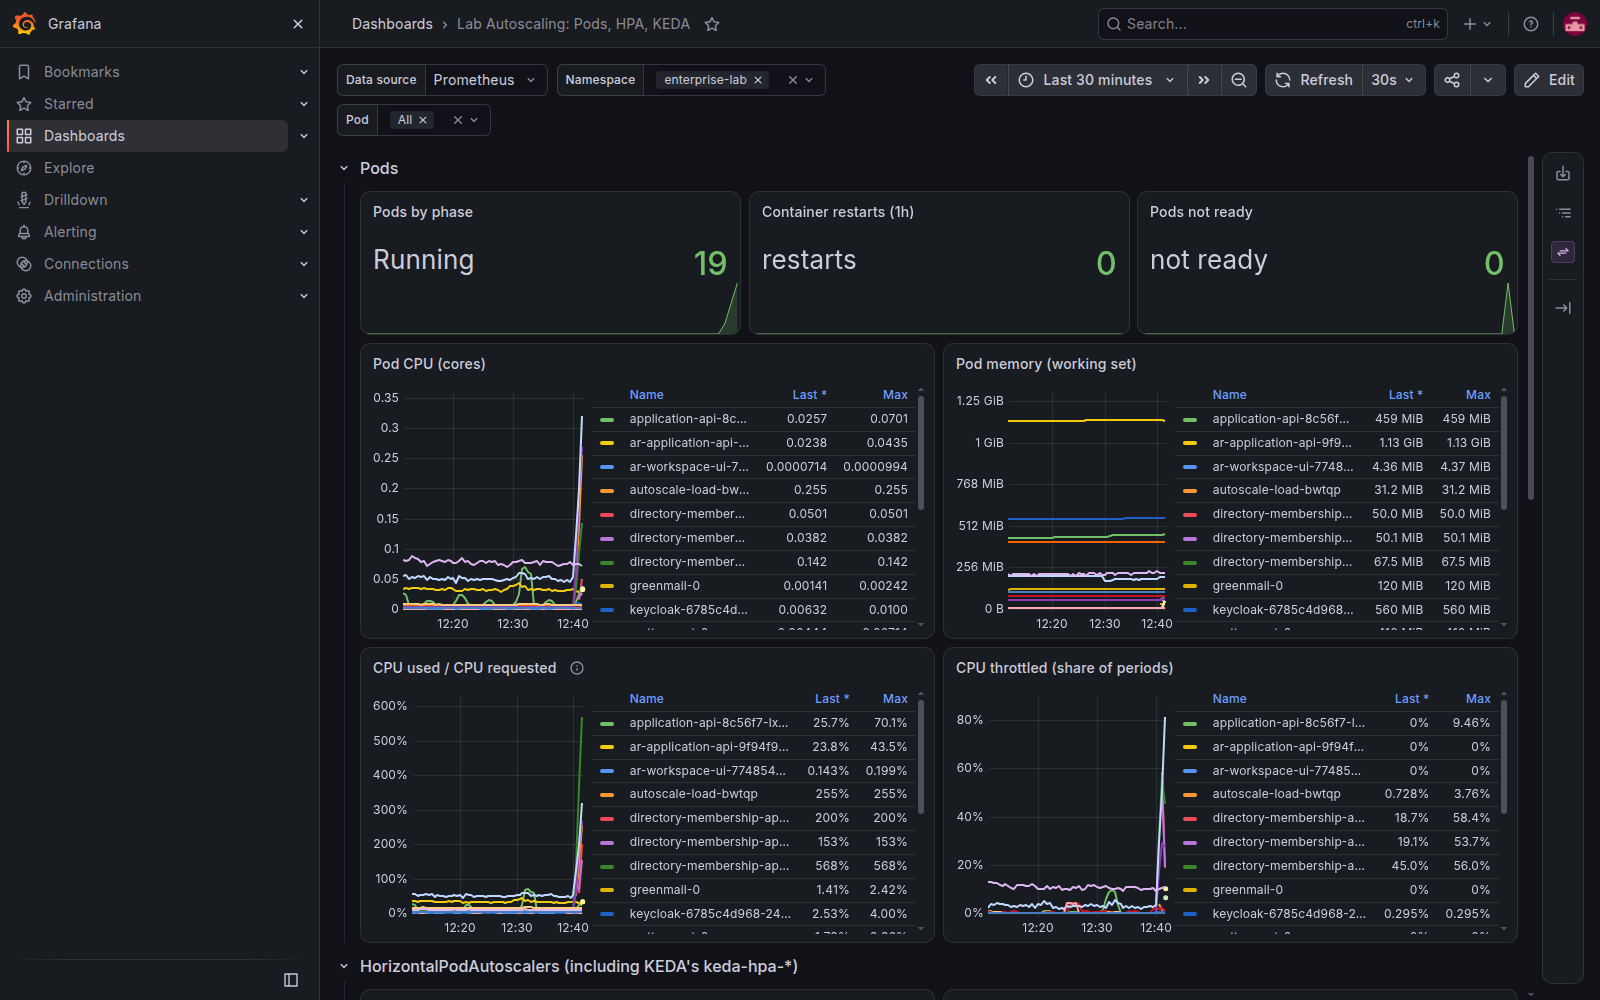
Grafana dashboard: pods by phase (19 running), restarts 0, not ready 0, with per-pod CPU, memory, CPU-versus-request and throttling charts.
Pods. Phase, restarts, readiness, CPU, memory, CPU against request, and throttling, for every pod in the namespace.

Engineering by Tarik Riley

Two ways to scale

A standard autoscaler on one service, KEDA on the other.

HPA · directory membership service

Scale on CPU

A standard Kubernetes Horizontal Pod Autoscaler: target 70% of the CPU each pod requests, 1 to 3 replicas. The service reads from the directory and keeps no state of its own, so a second copy is safe.

KEDA · CRM service

Scale on a Prometheus query

KEDA runs a Prometheus query over the service's real CPU and scales so each replica carries about 150 millicores, from 1 to 3. If Prometheus can't be read three times in a row, it holds one replica rather than guessing.

Just as important

Why some services are deliberately not autoscaled.

An autoscaler on a service that isn't safe to run twice does real damage. Each candidate was checked first.

SERVICEWHY IT STAYS AT ONE COPY
Fiduciary APIRuns about ten background loops inside the web process (watchers, an outbox drain, an execution worker). A second copy would double-poll connectors, double-send alerts and race the worker. It needs leader election or a separate worker first.
Workflow workerCopies would share one single-writer volume holding an idempotency file and an audit log.
AIM's own serviceIts collection scheduler runs in-process, so two copies would collect everything twice.
Databases, identity, queuesStateful by design. They scale through replication, not an autoscaler.

Inside AIM: the Performance tab

The same numbers, on AIM's own screen.

Grafana stays private to the lab; it isn't exposed on the network. To put these metrics on AIM's screen, AIM's service answers a fixed set of Prometheus queries itself, and its screen charts them. The browser can never send a query of its own, and needs no Grafana login.
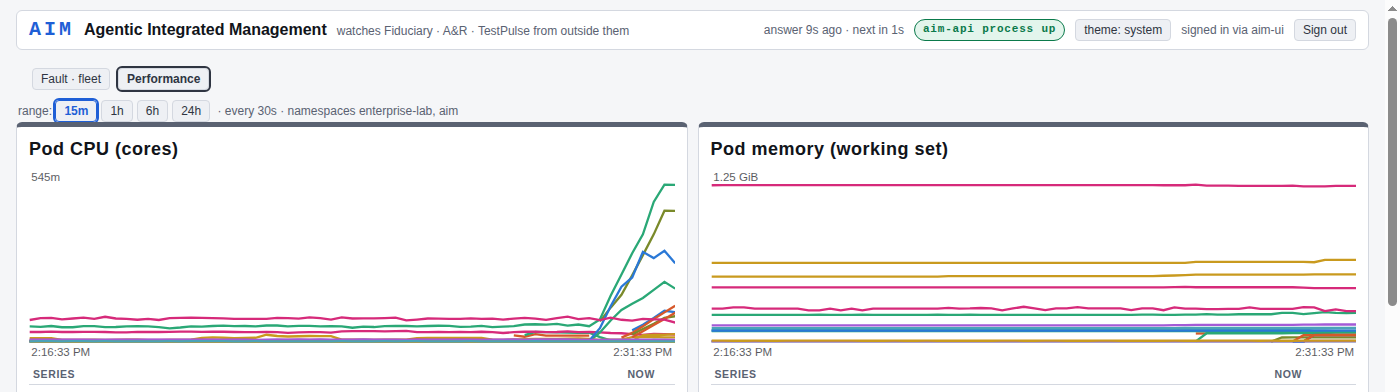
The AIM screen's Performance tab: AIM's header with the aim-api process up, a 15-minute range selector, and per-pod CPU and memory charts for the enterprise-lab and aim namespaces, with CPU climbing under load.
Performance tab. Real AIM UI, live lab data under load, 2026-10-17: per-pod CPU and memory across the enterprise-lab and aim namespaces, refreshed every 30 seconds.
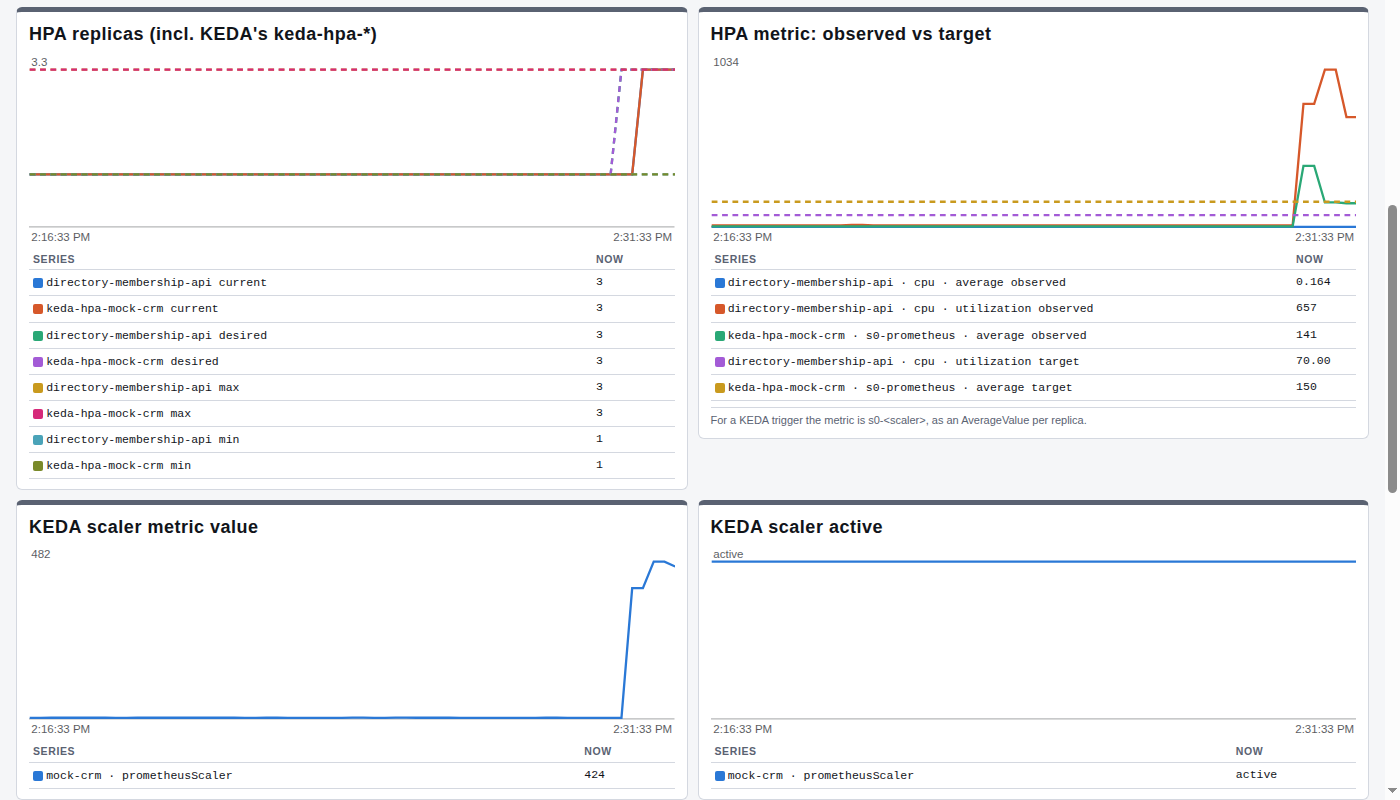
The AIM Performance tab's autoscaling panels: HPA replicas with directory-membership-api at 3 and keda-hpa-mock-crm at 3 of 3, observed versus target metrics, and the KEDA scaler value for mock-crm at 424 against a target of 150, scaler active.
Autoscaling in AIM. Real AIM UI, live lab data under load, 2026-10-17: directory-membership-api at 3 replicas, keda-hpa-mock-crm at 3/3, and the KEDA scaler value at 424 against a target of 150.

Engineering by Tarik Riley

Status

Prometheus, Grafana, KEDA, both autoscalers and the dashboard are live on the lab, recorded 2026-10-17. AIM UI Performance tab: in review (testpulse-aim PR #23), running on the lab. Alertmanager is deliberately off, because AIM is the lab's alarm surface. All data is synthetic.

Talk to us about applying FCAPS to your AI.

If you run an operations team that already speaks FCAPS, AIM gives the AI the same five lenses: Fault, Configuration, Accounting, Performance and Security.

Request the Fiduciary preview

Fill this in and we'll open your mail app with a message pre-filled to support@bmi2.com. Preview access is invite-only and pairs a design partner with an engineer for one workflow end to end.

A&R design partner program

Fill this in and we'll open your mail app with a message pre-filled to support@bmi2.com. A&R (Artists & Repertoire) is at the design-partner stage — we run one real artist-development workflow with each partner before any GA claims.

Talk about AIM

Fill this in and we'll open your mail app with a message pre-filled to support@bmi2.com. AIM (Agentic Integrated Management) applies FCAPS operational discipline to the AI itself — persona health, workflow drift, spend, audit, deployment.

Contact BMI2

Send us a message and we'll route it to support@bmi2.com. Round Rock, Texas · Mon–Fri, 9:00–17:00 CT. Prefer email? support@bmi2.com also works.